Nectara

PASCOM

Clinically Validated PET-MRI Post-Processing Tool for Precise Epileptogenic Zone Localization

Know More

When science and precision unite, diagnosis gets clearer than ever

Nectara PASCOM™ (PET asymmetry after anatomical symmetrization coregistered to MRI) is a novel imaging post-processing tool that enhances the diagnostic yield of FDG-PET in drug-resistant epilepsy by quantifying interhemispheric metabolic asymmetry after correcting for structural brain asymmetry. Designed for clinicians and researchers, Nectara PASCOM™ streamlines the identification and lateralization of the epileptogenic zone (EZ), offering higher precision than conventional visual PET analysis.


MRI Scan

Why Nectara PASCOM ?

Challenges with Visual Analysis


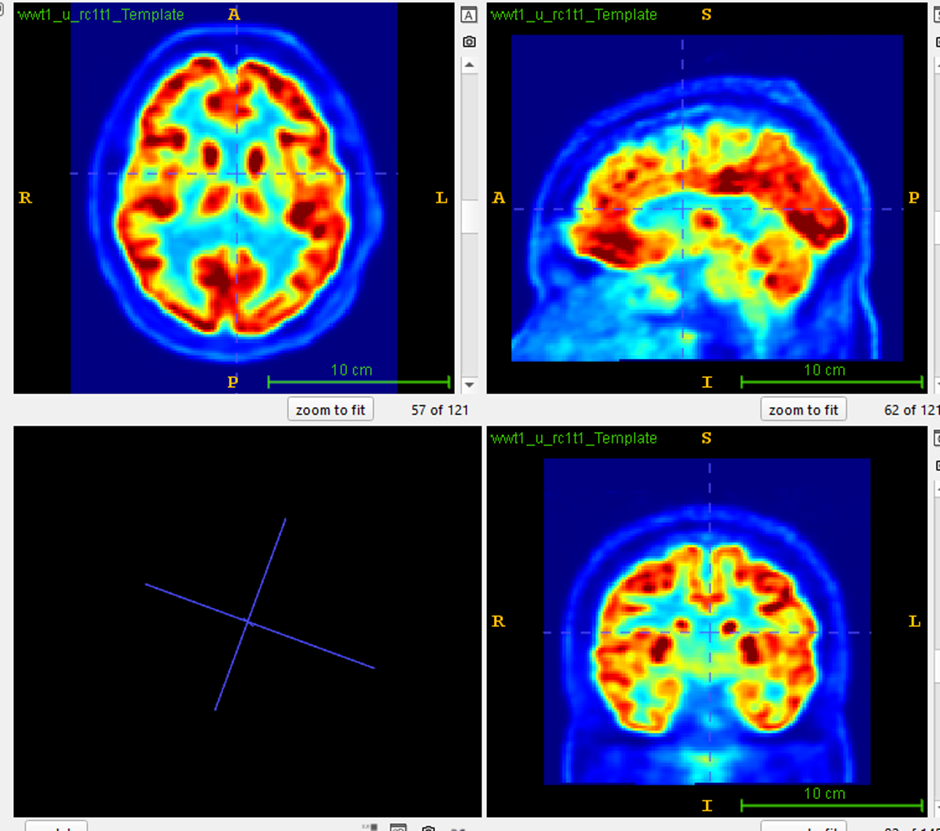
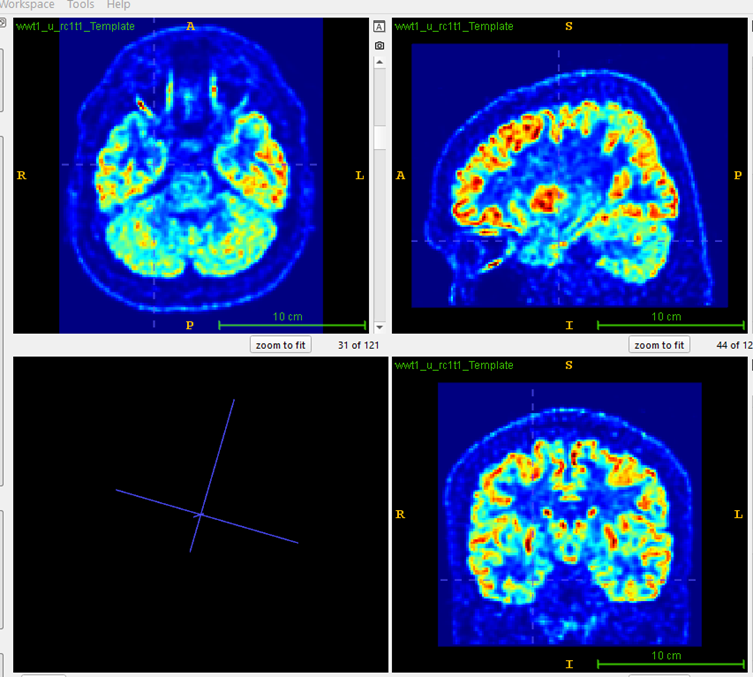
Conventional PET interpretation relies on expert visual identification of maximum area of hypometabolism. This is often hindered by multiple areas of different degrees of hypometabolism, making it difficult to pinpoint the maximum area of   hypometabolism. This is compounded by interhemispheric differences and anatomical asymmetries. This subjectivity can reduce localization accuracy, especially in MRI-negative cases and in multilesional cases.

No Normative Database Required


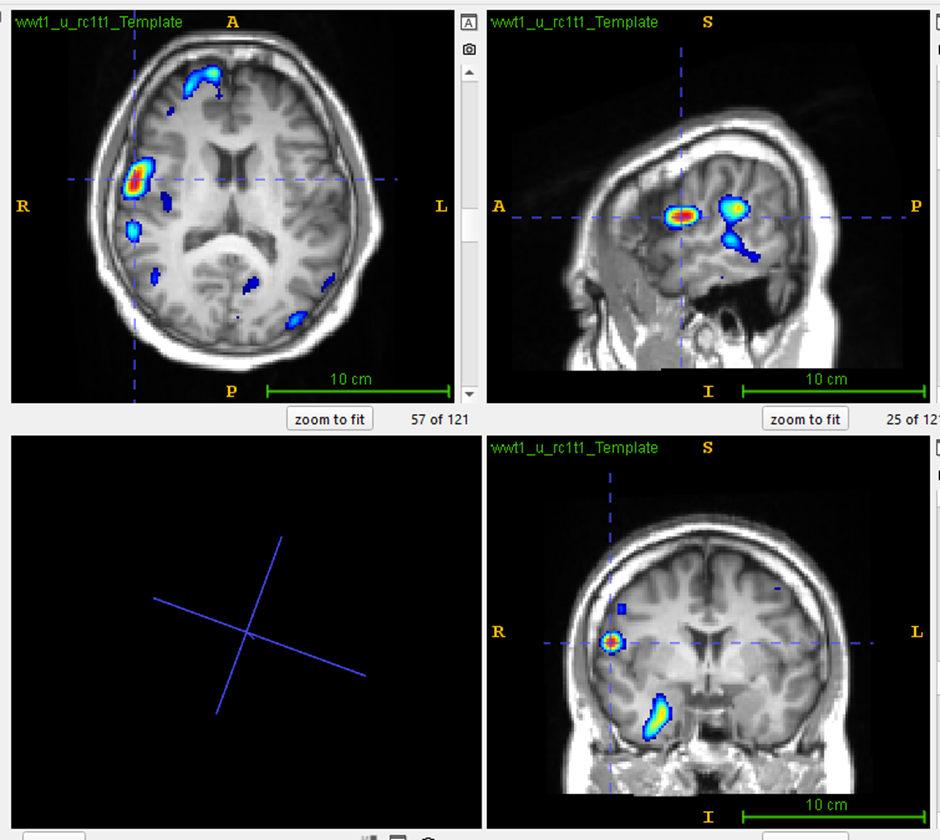
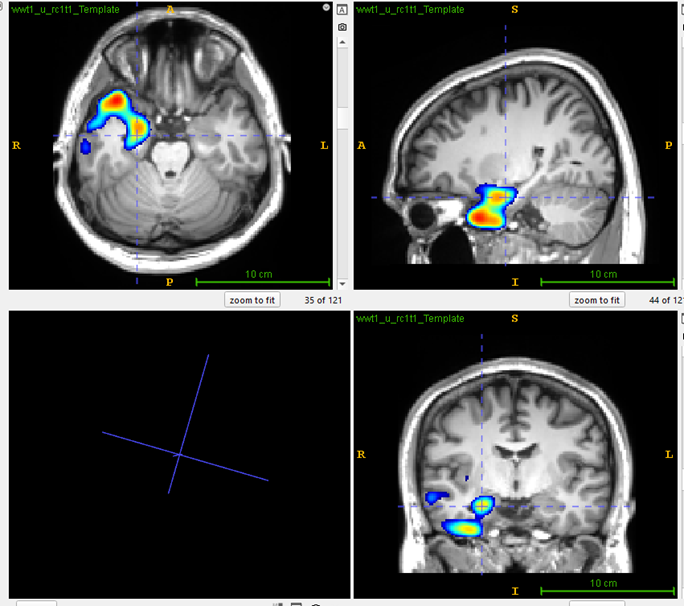
Asymmetry Index-based PET analysis has demonstrated superior accuracy in localizing hypometabolism compared to statistical parametric mapping methods that rely on global normalization (Bogaert et al., 2000; Kim et al., 2003; Soma et al., 2012; Didelot et al., 2010). Unlike conventional techniques, PASCOM utilizes the patient’s own MRI and PET data, applying a proprietary algorithm that corrects for interhemispheric metabolic asymmetry to precisely identify the epileptic focus.

MRI Scan

Key Features


Anatomically Symmetrized FDG-PET Analysis


Nectara PASCOM generates a personalized symmetrical brain template using high-resolution T1-weighted and FLAIR MRI, ensuring voxel-wise alignment for accurate interhemispheric comparison.


Automated Asymmetry Index (AI) Calculation


Voxel-wise asymmetry is quantified using a robust AI formula and z-score thresholding. This enables objective detection of focal hypometabolism with optimized thresholds (Z4: z-score > 4).


Performance-Driven Metrics


Nectara PASCOM™ outperforms blinded visual PET analysis in sensitivity, specificity, and lateralization accuracy. In a retrospective validation study, the Z4 threshold achieved 73% sensitivity, 96% specificity, and 100% lateralization accuracy.


Multimodal Integration


Seamlessly coregistered with MRI, Nectara PASCOM™'s output supports clinical decision-making in multidisciplinary team (MDT) discussions and surgical planning


Trusted Worldwide in Epilepsy Surgery Planning


Nectara PASCOM has been used by leading epilepsy centers outside the United States in the presurgical evaluation of more than 1,000 patients. International clinicians rely on its advanced PET-MRI asymmetry analysis to support confident localization of epileptogenic zones, particularly in complex or MRI-negative cases.


Clinical Utility (FDA Disclaimer)


SNectara Focus is an investigational software device and has not yet been cleared or approved by the U.S. Food and Drug Administration (FDA). It is currently limited by federal law to investigational use only. The software is intended for evaluation in clinical research settings and should not be used for primary diagnostic or treatment decisions unless and until FDA clearance is granted.


Clinical Utility

PASCOM is ideal for:

Presurgical Evaluation

Presurgical Evaluation

in drug-resistant epilepsy

Quantitative Support

Quantitative Support

during MDT discussions

MRI-Negative Patients

MRI-Negative Patients

with subtle or no structural abnormalities

Research and Retrospective Analyses

Research and Retrospective Analyses

of FDG-PET data

Case Studies


Case Study 01:

Frontal lobe epilepsy -
MRI negative

MRI Scan

Visual analysis: PET image of a drug-resistant frontal epilepsy patient, Hypometabolism not very focal and evident.

MRI Scan

PASCOM: Focal hypometabolism was localized at the right inferior frontal lobe.

Case Study 02:

Temporal lobe
epilepsy

MRI Scan

Visual analysis: PET scan of a patient with drug-resistant temporal lobe epilepsy showed bilateral temporal lobe hypometabolism.

MRI Scan

PASCOM: Focal hypometabolism was localized to right hippocampus and temporal pole cortex.

Case Study 03:

Posterior cortex
epilepsy

MRI Scan

Visual analysis: PET scan of a patient with drug-resistant temporal lobe epilepsy showed bilateral temporal lobe hypometabolism.ent.

MRI Scan

PASCOM: Focal hypometabolism was localized to right hippocampus and temporal pole cortex.

How It Works


01


Input

Interictal FDG-PET, T1-weighted MRI, and FLAIR MRI

02


Processing:

MRI-based anatomical symmetrization using DARTEL


Voxel-wise asymmetry index calculation


Smoothing and z-score transformation

03


Output

Clustered AI maps indicating focal hypometabolism


Overlay on native MRI for visual inspection

Publications


Aslam S, Damodaran N, Rajeshkannan R, Sarma M, Gopinath S, Pillai A. Asymmetry index in anatomically symmetrized FDG-PET for improved epileptogenic focus detection in pharmacoresistant epilepsy. J Neurosurg. 2022 Aug 5;138(3):828-836. doi: 10.3171/2022.6.JNS22717. PMID: 35932262.

Patent


Title

System and a Method Thereof for Automatic Detection of Epileptogenic Focus in Pharmacoresistant Epilepsy

Inventors

Shameer ASLAM, Ashok PILLAI, Siby GOPINATH, Natesan DAMODARAN, Ramiah RAJESHKANNAN, Manjit SARMA

Publication Number

US 2024/0398328 A1 (43) Pub. Date: Dec. 5, 2024

Click Here

Reference


  1. Aslam S, Damodaran N, Rajeshkannan R, Sarma M, Gopinath S, Pillai A. Asymmetry index in anatomically symmetrized FDG-PET for improved epileptogenic focus detection in pharmacoresistant epilepsy. J Neurosurg. 2022 Aug 5;138(3):828-836. doi: 10.3171/2022.6.JNS22717. PMID: 35932262.

  2. Kim YK, Lee DS, Lee SK, et al. Differential features of metabolic abnormalities between medial and lateral temporal lobe epilepsy: quantitative analysis of (18)F-FDG PET using SPM. J Nucl Med. 2003; 44(7): 1006-1012.

  3. Soma T, Momose T, Takahashi M, et al. Usefulness of extent analysis for statistical parametric mapping with asymmetry index using inter-ictal FGD-PET in mesial temporal lobe epilepsy. Ann Nucl Med. 2012; 26(4): 319-326.

  4. Didelot A, Mauguière F, Redouté J, et al. Voxel-based analysis of asymmetry index maps increases the specificity of 18FMPPF PET abnormalities for localizing the epileptogenic zone in temporal lobe epilepsies. J Nucl Med. 2010; 51(11): 1732-1739. J Nucl Med. 2003;44(7):1006-1012.